
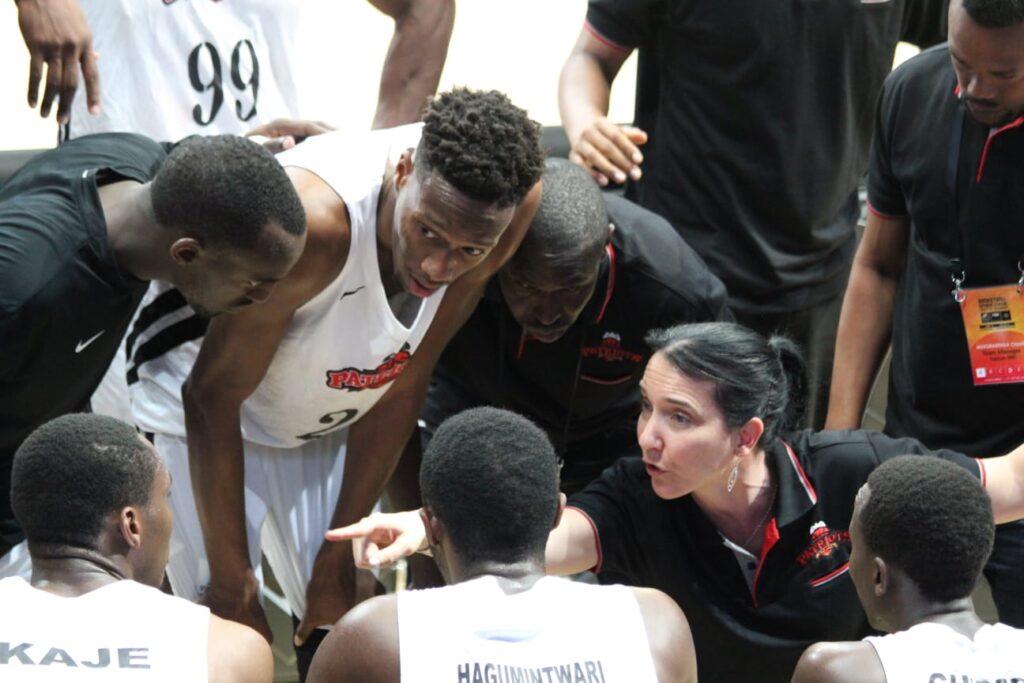
Providing accurate statistics for basketball games is still about as foreign as keeping time in African basketball culture. But I believe the tide is turning, especially with people like Coach Liz Mills providing advanced stats for major tournaments, like the recently-concluded Afrobasket qualifiers in Rwanda.
So I asked Coach Liz to break down the meaning of statistics “lingo” and to help us all understand what we’re really looking at in the box score at the end of a game. You’re welcome 🙂
BY SILALEI SHANI
Liz, what impressed you the most about the qualifiers in Rwanda?
Considering the impact of COVID I was really impressed that all 16 teams came and competed at a high level. We definitely watched some entertaining basketball, with the top teams taking care of business and some teams like Uganda performing beyond expectations. Congratulations to their coaching staff and players for a great performance.
What impact did Covid have on the teams that showed up?
COVID significantly impacted the players that coaches could select. Players based in countries with strict COVID restrictions could not travel to join their teams. It also had an impact on the preparation of these teams. Generally, most national teams don’t have a long preparation period but with COVID restrictions, training camps were shortened further and a number of players arrived late to join their teams.
We haven’t seen a breakdown of statistics like yours on the continent in a long time, if ever. What are you hoping to achieve by sharing this information?
I hope to shine a light on the performance of African players and teams. While statistics are by no means the only way to evaluate a player’s performance, they are a great way to objectively quantify how a player or team has performed and allows you to more easily compare players and teams.
Advanced analytics is still very much an untouched area in African basketball and any team that is looking to gain a competitive advantage would be wise to incorporate them into their scouting and decision-making.
Several teams went undefeated but Tunisia had a net rating of 28, does this make them the best team of the tournament?
An efficient team scores more points with its given possessions and prevents their opponents from scoring points on their given possessions. Tunisia, Nigeria, Egypt and Senegal finished the second window with 3-0 win/loss record but what separates Tunisia from these teams is their efficiency.
How is Net rating calculated?
Net rating is an advanced efficiency metric. The best teams in basketball are the most efficient. In a game each team will have the same number of possessions (+ or – 1 or 2). At the team and player level net rating is calculated by subtracting a team or player’s defensive rating from their offensive rating. At the team level offensive rating is how many points a team scores per 100 possessions and defensive rating is how many points a team gives up (or their opponents score) per 100 possession.
Senegal and Tunisia’s players dominated the defensive rating how is that calculated?
At the player level defensive rating estimates how many points a player allows per 100 possessions he faced while on the floor. The foundation of the calculation is the concept of the individual “Defensive Stop”. These stops take into account the instances of a player ending an opponent’s possession via a block, steal or defensive rebound (all found in the box score), in addition to an estimate for the number of forced turnovers and forced misses by the player which aren’t captured by steals and blocks.
So what does someone who wants to make the defensive rating list need to focus on in terms of their game?
If a player is looking to make the list for defensive rating they need to help their overall team’s defensive rating first and foremost. However on an individual level players should look to create stops – steals, blocks and defensive rebounds.
Is a strong offensive rating simply about the points a player scores?
On a player level offensive rating is about how many points a player produces per 100 possessions. Points produced represents the number of points a player generates through various offensive contributions, including assists, field goals, free throws and offensive rebounds. Therefore offensive rating takes into account a players overall offensive contribution, not just their scoring.
Can a team that has a strong offensive rating and a weak defensive one or vice versa, still excel in a tournament?
No. If there is a big disparity between the two then it is hard for a team to excel. If we take Group E for example every team in this group had a high offensive rating however Uganda, Cape Verde and Morocco finished in the bottom 3 for defensive rating of the 16 teams participating in the second window. Egypt finished 10th out of 16. The reason why Egypt won this group is because they had the best defensive rating of the 4 teams and as a result had the best Net Rating.
What is “Stop %”?
Stop percentage is the rate at which a player forces a defensive stop (steal, block, defensive rebound etc) as a percentage of individual possessions faced. A player who has a 0.68 stop % has a 68% chance of causing a defensive stop every possession he faces on defense.
What is a “Player Impact Estimate”?
PIE indicates the positive or negative impact a player had on a game by comparing his individual stats to that of the total game stats (team & opponents stats). The stats being analyzed are the traditional box score stats and PIE, like PER or +/-, can be used to evaluate a players overall performance.
What is Usage %?
Usage percentage is an estimate of the percentage of a team’s plays used by a specific player while he is on the floor. The higher the usage for a particular player, the more likely that player is the primary option for the team when that player is on the court.
How does understanding the stats terminology help a team or an individual player improve their game?
For coaches, understanding these advanced stats can help them make better decisions for their teams. By incorporating these stats with scouting reports and film break-down, coaches have more information at their disposal and therefore can make better decisions that help improve their teams. On a player level by understanding these stats they can assess areas where they need to improve or continue to develop.
What would you like to see improve stats wise in the 2nd window in February 2021?
DEFENSE! I’m a defensively minded coach so I’m always looking at how teams can improve in this area and I’d love to see more teams focus on this. As the advanced stats reveal, there are plenty of teams in Africa who can score but defensive ratings for most teams needs to be improved. This can make a huge difference to a team winning or losing. I’d also like to see teams become more efficient so we can see more teams have positive, rather than negative, net ratings.
Numbers don’t lie, folks! Thanks to people like Coach Liz Mills providing advanced stats, gone are the days of guess work. Do your homework and when it’s time for the test, it’ll be that much easier. See you all in February 2021.
*Follow Coach Liz Mills on Twitter for a full breakdown of the 2020 Afrobasket Qualifiers Statistics

and “Ball’n Africa” TV shows (both on SPNAfrica.com ) and a basketball commentator.


